.png)
The Debt That Runs the World
- MS Blogs

- Apr 14
- 10 min read
Updated: Apr 15
A Story of the United States, and the Nature of Borrowed Power

1. The Number Everyone Knows, But Few Contextualize
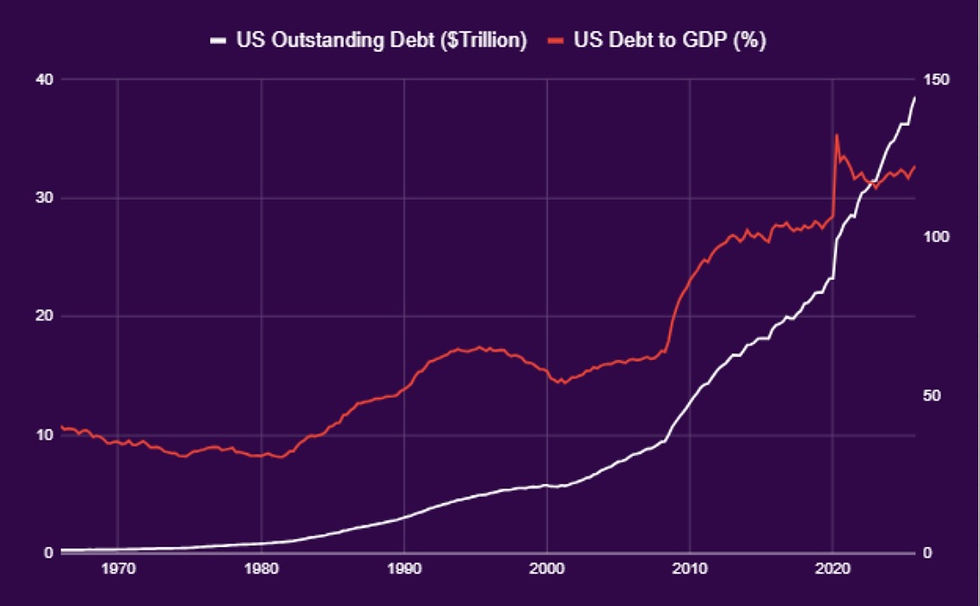
The United States today carries over $39 trillion in federal debt.
At face value, that number feels abstract, too large to comprehend, too familiar to question. But absolute numbers are analytically weak without structure. Debt must be evaluated through four lenses:
Growth vs. borrowing cost - is the economy expanding faster than the interest bill?
Composition of spending - is borrowed money funding capacity or consumption?
Ownership structure - who holds the debt, and what are the geopolitical implications?
Monetary regime - what backs the currency, and how much flexibility does the issuer have?
This is not just a fiscal story. It is a monetary architecture story - one of cycles, choices, and compounding consequences.
2. How Did We Get Here? A Timeline of Expansion
US federal debt has not accumulated gradually, it has expanded in discrete bursts tied to moments of structural stress. The first major inflection came during World War II, when debt-to-GDP crossed 100%. What followed was the most favorable debt dynamic: through the 1950s to 1970s, real GDP grew at a CAGR of roughly 3.8–4.2%, driven by manufacturing dominance, the Interstate Highway buildout, and defense-industrial R&D. The economy was production-led, and debt declined relative to GDP even as absolute spending rose. The critical identity of sovereign sustainability held firmly: growth rate > interest rate + debt accumulation.
The structural break arrived in 1971, when the collapse of Bretton Woods moved the US to a pure fiat system, unlocking fiscal capabilities previously considered impossible: persistent twin deficits, large-scale transfer payments, and crisis-driven bailouts.
However post that, Reagan-era tax cuts, post-9/11 wars, the 2008 Financial Crisis, and COVID-19 stimulus each added significant tranches of borrowing. But the defining shift across this arc is not that the US borrowed heavily during crises, it is that debt no longer meaningfully declines afterward. Crisis-driven debt has become permanent, structural debt.
3. The Cost of Carrying the System
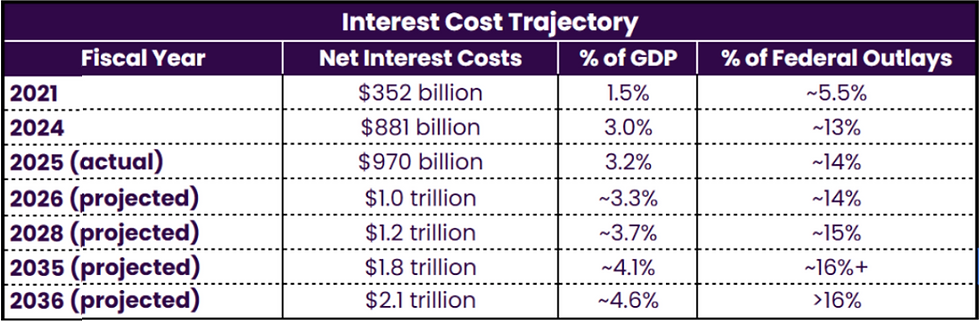
Debt is not free. The US now spends over $900 billion annually on interest payments, one of the largest line items in the federal budget, now exceeding defense spending in some years, and growing faster than most other expenditures.

The US figure looks moderate in isolation. But the trajectory matters more than the current level. The feedback loop is clear: more debt → higher interest → more borrowing → even higher debt. At low rates, this loop is manageable. At higher rates, it becomes self-reinforcing pressure.
India’s figures seem high in comparison because of its higher interest rates and on account of it being an emerging economy, its interest payments are comparable with similar emerging economies like Brazil - 24%, Bangladesh - 24%, etc. Moreover, India’s debt to GDP ratio is in a better shape than the US as its GDP growth has outpaced its debt growth


4. Who Owns the Debt?
Understanding ownership is critical to understanding risk.
Domestic holders — the Fed, US banks, pension funds, and mutual funds account for roughly 75% of the debt stack. This portion is manageable: domestic institutions that hold treasuries in local currency, cannot trigger a foreign exchange crisis by selling, and can be influenced through monetary policy and regulatory frameworks in ways foreign creditors cannot. The Fed can intervene as a buyer of last resort. Rolling over domestic debt does not require continuously attracting foreign capital at market rates.
Foreign holders — led by Japan (~$1.2 trillion), UK (~$895 billion), along with the top 15 countries comprise of 80% of the foreign holding. This is where vulnerability concentrates. Foreign holders demand market-rate compensation and can exit. A coordinated sell-off by even a subset would push Treasury yields sharply higher across the entire debt stack.
That earned credibility is now under quiet pressure. The freezing of Russian reserves post-Ukraine signaled to sovereign wealth managers globally that dollar-denominated assets carry political risk. The response has been gradual but visible, emerging market central banks building gold reserves, bilateral trade settling in local currencies, and marginal diversification away from Treasuries. Combined with any softening of the petrodollar recycling mechanism, the result is the same: reduced automatic demand for US debt, and a higher cost to attract whatever foreign capital remains.
5. What Did the US Spend This Debt On?
Debt is not inherently good or bad, it depends entirely on how it is deployed. Productive uses like infrastructure, defense innovation, and research expand future economic capacity and can, over time, pay for themselves.
Transfer-heavy spending, Social Security, medicare, income subsidies supports stability but generates no incremental economic output. The share of mandatory outlays as a % of GDP increased from around 8 - 9% of GDP in the 1980’s to 17% in 2026, this critical shift over the past four decades from investment-led debt to consumption and transfer-led debt, partially explains why post-WWII growth compressed debt ratios while post-2008 growth has not.
A secondary, often underappreciated effect: reserve currency status extends its advantages beyond the sovereign balance sheet to US corporations. When Apple Inc. or Microsoft Corporation issue 10-year bonds, they borrow at roughly 3–4%, while comparably rated Brazilian or Indian firms pay 7–9%. This 300–500 basis point gap is not merely a function of credit risk; it reflects the structural demand for dollar-denominated assets and the depth of markets anchored by the US’s reserve currency status.
Across over $9 trillion in US investment-grade corporate bonds outstanding, even a conservative 200 basis point differential is shown in annual interest savings flowing directly into earnings margins, capital investment, and competitive capacity. The privilege compounds quietly, far beyond what appears on any government balance sheet
6. Debt Is Not a US Story - It Is a Cycle
To understand where this leads, it helps to zoom out. Debt cycles have played out across history and geographies. Two cases are particularly instructive.
Japan - Stability Without Growth
After its asset bubble burst in the early 1990s, Japan responded with continuous fiscal stimulus. Today its debt-to-GDP exceeds 250%, the highest among major economies, yet it has not collapsed. The reason is largely mechanical.
This model was made possible by deep structural factors: a predominantly domestic investor base, persistently high savings, and a deflationary backdrop that made low-yield bonds acceptable, alongside Japan’s strong external balance sheet. With limited domestic returns, Japanese institutions were structurally incentivized to deploy capital overseas, funded by low-yield yen liabilities and invested in higher-yielding foreign assets, with currency dynamics often amplifying returns.
The result is a system that appears stable on the surface, but is partially sustained by a system-level carry dynamic embedded within it.
Greece - When Markets Lose Confidence
Greece illustrates what happens when confidence breaks. In 2009, debt stood at 127% of GDP, elevated but not extraordinary. What triggered the crisis was the revelation that the deficit was running at 15.7% of GDP, which was nearly triple of what had been officially reported, with external creditors holding the majority of debt and no domestic monetary authority able to intervene.
This led to -
Bond yields spiking from 4–5% in 2008 to above 35% by early 2012 that made refinancing impossible.
Three bailout packages totaling €289 billion.
GDP contraction of 26% peak to trough and unemployment peaked at 27.5%.
7. Where Does the US Stand?
The US shares features with all of these cases, and the comparison is instructive rather than alarming.
Like Japan, the US carries high debt with predominantly domestic ownership, and its central bank retains significant tools to influence financing costs. But, it also has genuine growth drivers, technological leadership, deep capital markets, and institutional dominance that create a credible path to growing out from under its debt burden. Unlike Greece, it issues its own reserve currency, giving it the monetary sovereignty to manage refinancing in ways that Greece structurally cannot.
But one dimension of the comparison is worth noting. The reserve currency privilege is real and quantifiable: it is the reason the US can carry ~100% debt-to-GDP without a currency crisis, while a country like Argentina at 90% or Turkey at 40% of external-currency-denominated debt faces destabilizing pressure.
When Argentina's debt-to-GDP approached 100% in 2001, it triggered a sovereign default and a 40% real GDP contraction. When Turkey's foreign currency debt servicing costs rose sharply in 2018, the Lira lost nearly 30% of its value in a single year. The difference is not fiscal virtue, it is monetary architecture. The US borrows in the currency it prints, at rates set partly by its own central bank, with a domestic creditor base large enough to absorb most of the financing need without recourse to external markets.
That privilege, however, is not unconditional and the slow diversification of global reserve holdings, the quiet erosion of petrodollar recycling, and the increased political friction around dollar-denominated assets are precisely the kind of gradual signals that precede structural shifts. None of this suggests an imminent crisis. But it does suggest that the margin of comfort is narrowing.
8. The Maturity Wall: America's $9 Trillion Annual Refinancing Problem
Understanding that the US carries $39 trillion in debt is one thing. Understanding when that debt comes due and at what cost it must be refinanced is where the fiscal pressure becomes concrete.
The Scale of What's Rolling Over
The US does not borrow money once and pays it back decades later. Treasury securities mature constantly, requiring continuous refinancing. What has changed is the rate environment in which that refinancing is happening.
In FY2025, approximately $9.2 trillion of publicly held debt matured, roughly a quarter of the entire national debt, rolled over in a single fiscal year. As of early 2026, 33% of all publicly held marketable debt is scheduled to mature within the next 12 months. That is approximately $10 trillion of refinancing pressure in any given 12-month window.

The Rate Differential: The Core Problem
The average interest rate on the total marketable national debt was 1.51% in 2021. As of February 2026, it has risen to 3.36% and it is still climbing, because each maturity event reprices a tranche of the debt upward.
More than $3.1 trillion of the debt rolling over between April 2025 and March 2026 was originally issued before early 2023, prior to the Fed's rate hiking cycle reaching its peak meaning it is now being refinanced at materially higher rates than when it was first sold.
The Treasury's Tactical Response and Its Risk
Faced with this maturity wall at peak rates, the Treasury has adopted a "bill-heavy" strategy: leaning on short-duration T-bills rather than locking in long-term rates at current elevated levels. The logic is rational - issue short-term now, and extend duration once the Fed cuts rates meaningfully.
But this strategy carries its own risk profile. The more debt is held in bills, the more frequently the entire bill stock must be auctioned and refinanced, keeping the government continuously exposed to short-rate fluctuations. If inflation proves stickier than expected as structural drivers like tariffs and energy disruptions suggest, the plan stalls. The Treasury is essentially betting that it can weather the high-rate cycle in T-bills and extend duration once conditions improve. That bet is far from guaranteed.
The Compounding Feedback
Annual deficits are already projected to average over $2 trillion per year through the next decade, reaching $3 trillion+ by 2036. Debt held by the public, currently near 100% of GDP, is projected to reach 108% by 2030 and 120% by 2036, surpassing the post-WWII record of ~106%.
The Key Sensitivity: What a Rate Shock Would Cost
With approximately $39 trillion in total outstanding debt, every 25 basis points increase in the average interest rate adds roughly $95–100 billion in annual interest costs. If rates were to remain 100 basis points higher than currently projected which is not an extreme scenario, that alone would add $380–400 billion per year in additional costs relative to baseline. That is a figure larger than the entire US defense budget just a decade ago.
9. The Real Sustainability Equation
Sustainability is not about absolute debt levels. It is about three variables: whether the economy grows faster than its borrowing cost, whether the currency retains its structural demand, and whether spending generates future productive capacity. The US is under pressure on all three and its policy response is becoming increasingly visible.
What is emerging is a deliberate, if disruptive, attempt to reset the growth side of the equation. The CHIPS Act and associated AI infrastructure commitments represent over $500 billion in public and private capital allocation toward semiconductor and compute capacity, a direct bet that technological leadership can restore the productive-debt dynamic that characterized the 1950s–70s.
Simultaneously, the current administration's tariff posture, with effective rates reaching levels not seen since the 1930s is less a trade policy than a fiscal one: an attempt to onshore manufacturing, broaden the industrial base, and reduce structural trade deficits that have historically exported demand and suppressed domestic output, add to this the sustained strategic pressure on global energy markets from LNG export expansion to contested influence over Middle Eastern supply routes and the contours of a coherent, if aggressive, revenue thesis become visible: control the inputs of global economic activity, and you structurally reinforce dollar demand.
The tension, however, is that each of these moves simultaneously strains the relationships that make reserve currency privilege durable. Tariffs have prompted quiet retaliation and accelerated bilateral trade settlement outside the dollar system. The weaponization of financial infrastructure sanctions, reserve freezes, SWIFT exclusions has given sovereign wealth managers a concrete incentive to diversify, also the perception of the US as a unilateral actor rather than the architect of a rules-based order is eroding the trust premium that keeps global capital flowing into Treasuries at below-market-clearing rates.
The implicit trade-off being made is a significant one: the US appears willing to substitute long-term relationship capital, the soft infrastructure of reserve currency dominance for more immediate and controllable sources of fiscal strength. Whether that substitution holds depends on whether the productivity gains from AI investment and reindustrialization materialize faster than the erosion of the dollar's reserve share. That is not a guaranteed outcome. It is a wager and one with consequences that will compound quietly for years before they become impossible to ignore.
To put it simply, the US has only two real levers to manage its debt: increase revenue or grow the asset base.
References
U.S. Department of the Treasury. (n.d.). Major foreign holders of Treasury securities (Table 5).https://ticdata.treasury.gov/resource-center/data-chart-center/tic/Documents/slt_table5.html
World Bank. (n.d.). World Development Indicators database.https://data.worldbank.org
International Monetary Fund. (n.d.). IMF data and statistics.https://www.imf.org
Trading Economics. (n.d.). China: Interest payments (% of revenue).https://tradingeconomics.com/china/interest-payments-percent-of-revenue-wb-data.html
Our World in Data. (n.d.). Share of government expenditure going to interest payments.https://ourworldindata.org/grapher/share-of-government-expenditure-going-to-interest-payments
World Bank. (n.d.). Interest payments (% of revenue) – China.https://data.worldbank.org/indicator/GC.XPN.INTP.RV.ZS?locations=CN
Trading Economics. (n.d.). Japan: Interest payments (% of revenue).https://tradingeconomics.com/japan/interest-payments-percent-of-revenue-wb-data.html
Ministry of Finance, People’s Republic of China. (2026). Central government budget report (2026).http://yss.mof.gov.cn/2026zyczys/202603/t20260324_3986019.html
Nippon.com. (2024). Japan data report on fiscal indicators.https://www.nippon.com/en/japan-data/h02652/
Reuters. (2025, January 30). Japan’s government interest costs to swell more than 50% in coming years.https://www.reuters.com/markets/asia/japans-government-interest-costs-swell-more-than-50-next-few-years-2025-01-30/
Peter G. Peterson Foundation. (n.d.). Monthly interest tracker: National debt.https://www.pgpf.org/programs-and-projects/fiscal-policy/monthly-interest-tracker-national-debt/
Congressional Budget Office. (2025). The budget and economic outlook: 2026 to 2036.https://www.cbo.gov/publication/62105
Disclaimer: This article is for educational and informational purposes only and should not be considered investment advice or a recommendation to buy, sell, or hold any security.


Comments